Sediment
by Dr. Robert L. Beschta, Professor Emeritus, Oregon State University and Dr. George G. Ice, NCASI
Sediment or suspended solids monitoring in the Alsea Watersheds provided a number of important lessons to foresters and watershed managers. These lessons occurred during three distinct periods: the Alsea Watershed Study (AWS) pre-treatment period; AWS post-treatment period; and sediment and bedload monitoring after conclusion of the original study.
The pre-treatment calibration period was for Water Years 1959 through 1965 (Table 1).
Annual suspended sediment yields for the three research watersheds indicated considerable year-to-year variability during both the pre- and post-treatment periods. For example, annual sediment yields during the pre-treatment period were dominated by a large storm in late January 1965. Due to this storm, suspended sediment yields in WY 1965 for the three untreated watersheds were approximately three to four times the average annual yields for the pre-treatment period and approximately an order of magnitude larger than the lowest annual yields observed during that calibration period.
Table 1. Annual Suspended Sediment Yield
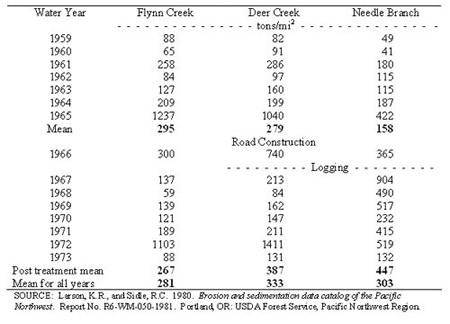
Treatments included clearcut logging and slash burning on the Needle Branch watershed and roading, patchcut logging, and burning on the Deer Creek watershed. Monitoring of post-treatment effects on in-stream suspended sediment production continued from WY 1966 through WY 1973 (Table 1).
While increased sediment yields occurred following road building, logging, and slash burning on Deer Creek and Needle Branch watersheds, the magnitude and temporal pattern of increases varied between watersheds.
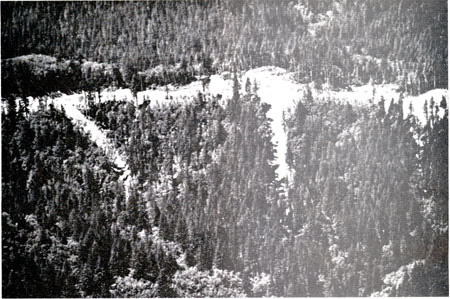
For Deer Creek, erosion from roads (Figure 1) appears to have been the major cause of sediment yield increases measured in WY 1966 and WY 1972. For Needle Branch, the relatively minor amount of road building on the watershed did not increase WY 1966 sediment yields over that predicted from the pre-treatment relation with Flynn Creek. However, the combination of clearcut logging, yarding, and slash burning on Needle Branch subsequently resulted in five consecutive years of significant increases in measured sediment yield. Initial increases were the greatest, followed by a general decline toward pre-treatment levels as vegetation recovered.
Figure 1. Landslides from Deer Creek logging roads (from Moring 1975).
Sedimentation studies associated with the AWS ascertained the magnitude and duration of increased watershed sediment yields and instream suspended sediment concentrations associated with forest practices typically used in the 1960s.
While results indicated that there was considerable variation in sediment production associated with individual forest practices, several general conclusions emerged. Minimizing road construction within a watershed, in conjunction with small clearcuts, forested stream buffers, and low-severity slash burns were practices that did not appear to cause significant increases in sediment production. Conversely, sidecast construction of mid-slope roads across headwalls and other over-steepened portions of a hillslope, and a combination of clearcutting a large portion of a watershed, yarding logs across stream channels, and high-severity slash burning causes increased sediment production from either mass failures or surface erosion.
These watershed-scale studies were important in that they illustrated the extent to which various forest practices could affect erosion processes. In doing so, they contributed to the development of management guidlelines designed to help minimize potential adverse effects of forest practices on water quality, stream systems, and aquatic habitats. Key paper on these topics include Brown and Krygier (1971), Harris and Williams (1971), Harris (1973, 1977), and Beschta (1978).
While the formal AWS concluded in 1973, there was continuing work in the Alsea Watersheds to understand sediment processes in forest streams.
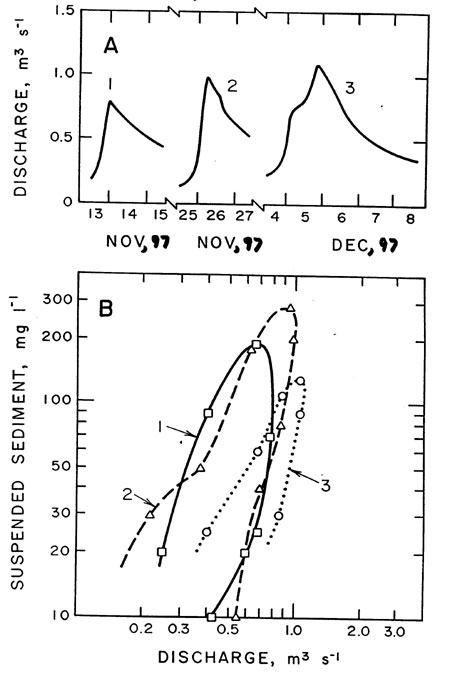
Monitoring in Flynn Creek confirmed the importance of a “hysteresis” effect for suspended sediment, with decreasing sediment concentrations for the fall limb of the hydrograph and for subsequent flows of equal discharge (Figure 2). This is typical of a sediment-limited system. For individual storms, particulate organic matter could comprise as much as 40% of the total suspended solids, with the remaining 60% inorganic sediment. Total suspended solids concentrations were found to be highly correlated with turbidity.
Figure 2. Time series of streamflow (Q), bedload transport (HS) and particular organic matter transport (POM) for a storm at Flynn Creek. Both bedload and particulate organic matter transport were measured with the Helley-Smith bedload sampler (from Beschta et al. 1981).
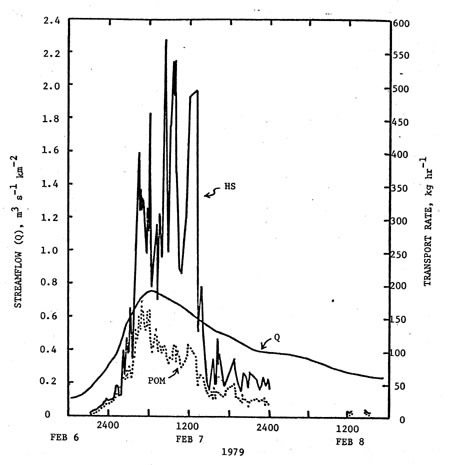
Bedload monitoring using a vortex weir (constructed in the Flynn Creek fish trap, originally used in the AWS) and a Helley-Smith sampler showed rapidly varying transport of coarse particulate organic matter and especially bedload (much greater variations than observed for discharge) (Table 2, Figure 3).
Comparison between bedload monitoring devices such as the vortex sampler and the Helley-Smith bedload sampler resulted in recommendations to improve trapping efficiency of the Helley-Smith sampler by increasing the bag size.
Table 2. Annual Bedload Yields – Flynn Creek
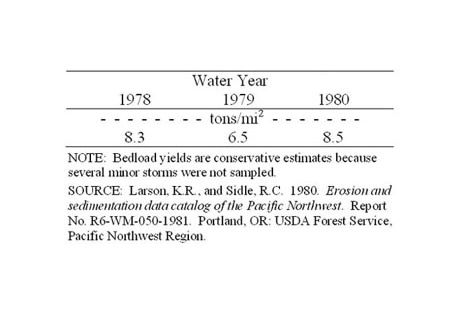
Figure 3. Flynn Creek (A) storm hydrographs and (B) sediment concentration vs. discharge.
These follow-up studies confirmed the dynamic nature of sediment transport in forest streams and helped guide watershed researchers to development of the current suspended solids monitoring protocols such as the turbidity threshold sampling schemes used in the current study. Key papers describing this work include Beschta (1980), O’Leary and Beschta (1981), Paustian and Beschta (1979), Van Sickle (1981), Jackson and Beschta (1982), and Van Sickle and Beschta (1982, 1983).
References
Jackson, W.L., and R.L. Beschta. 1982. A model of two-phase bedload transport in an Oregon Coast range stream. Earth Surface Processes and Landforms 7:517-527.
For additional references, see the publications list from the original study.
