Infographics
Biomass Carbon Cycle Diagram
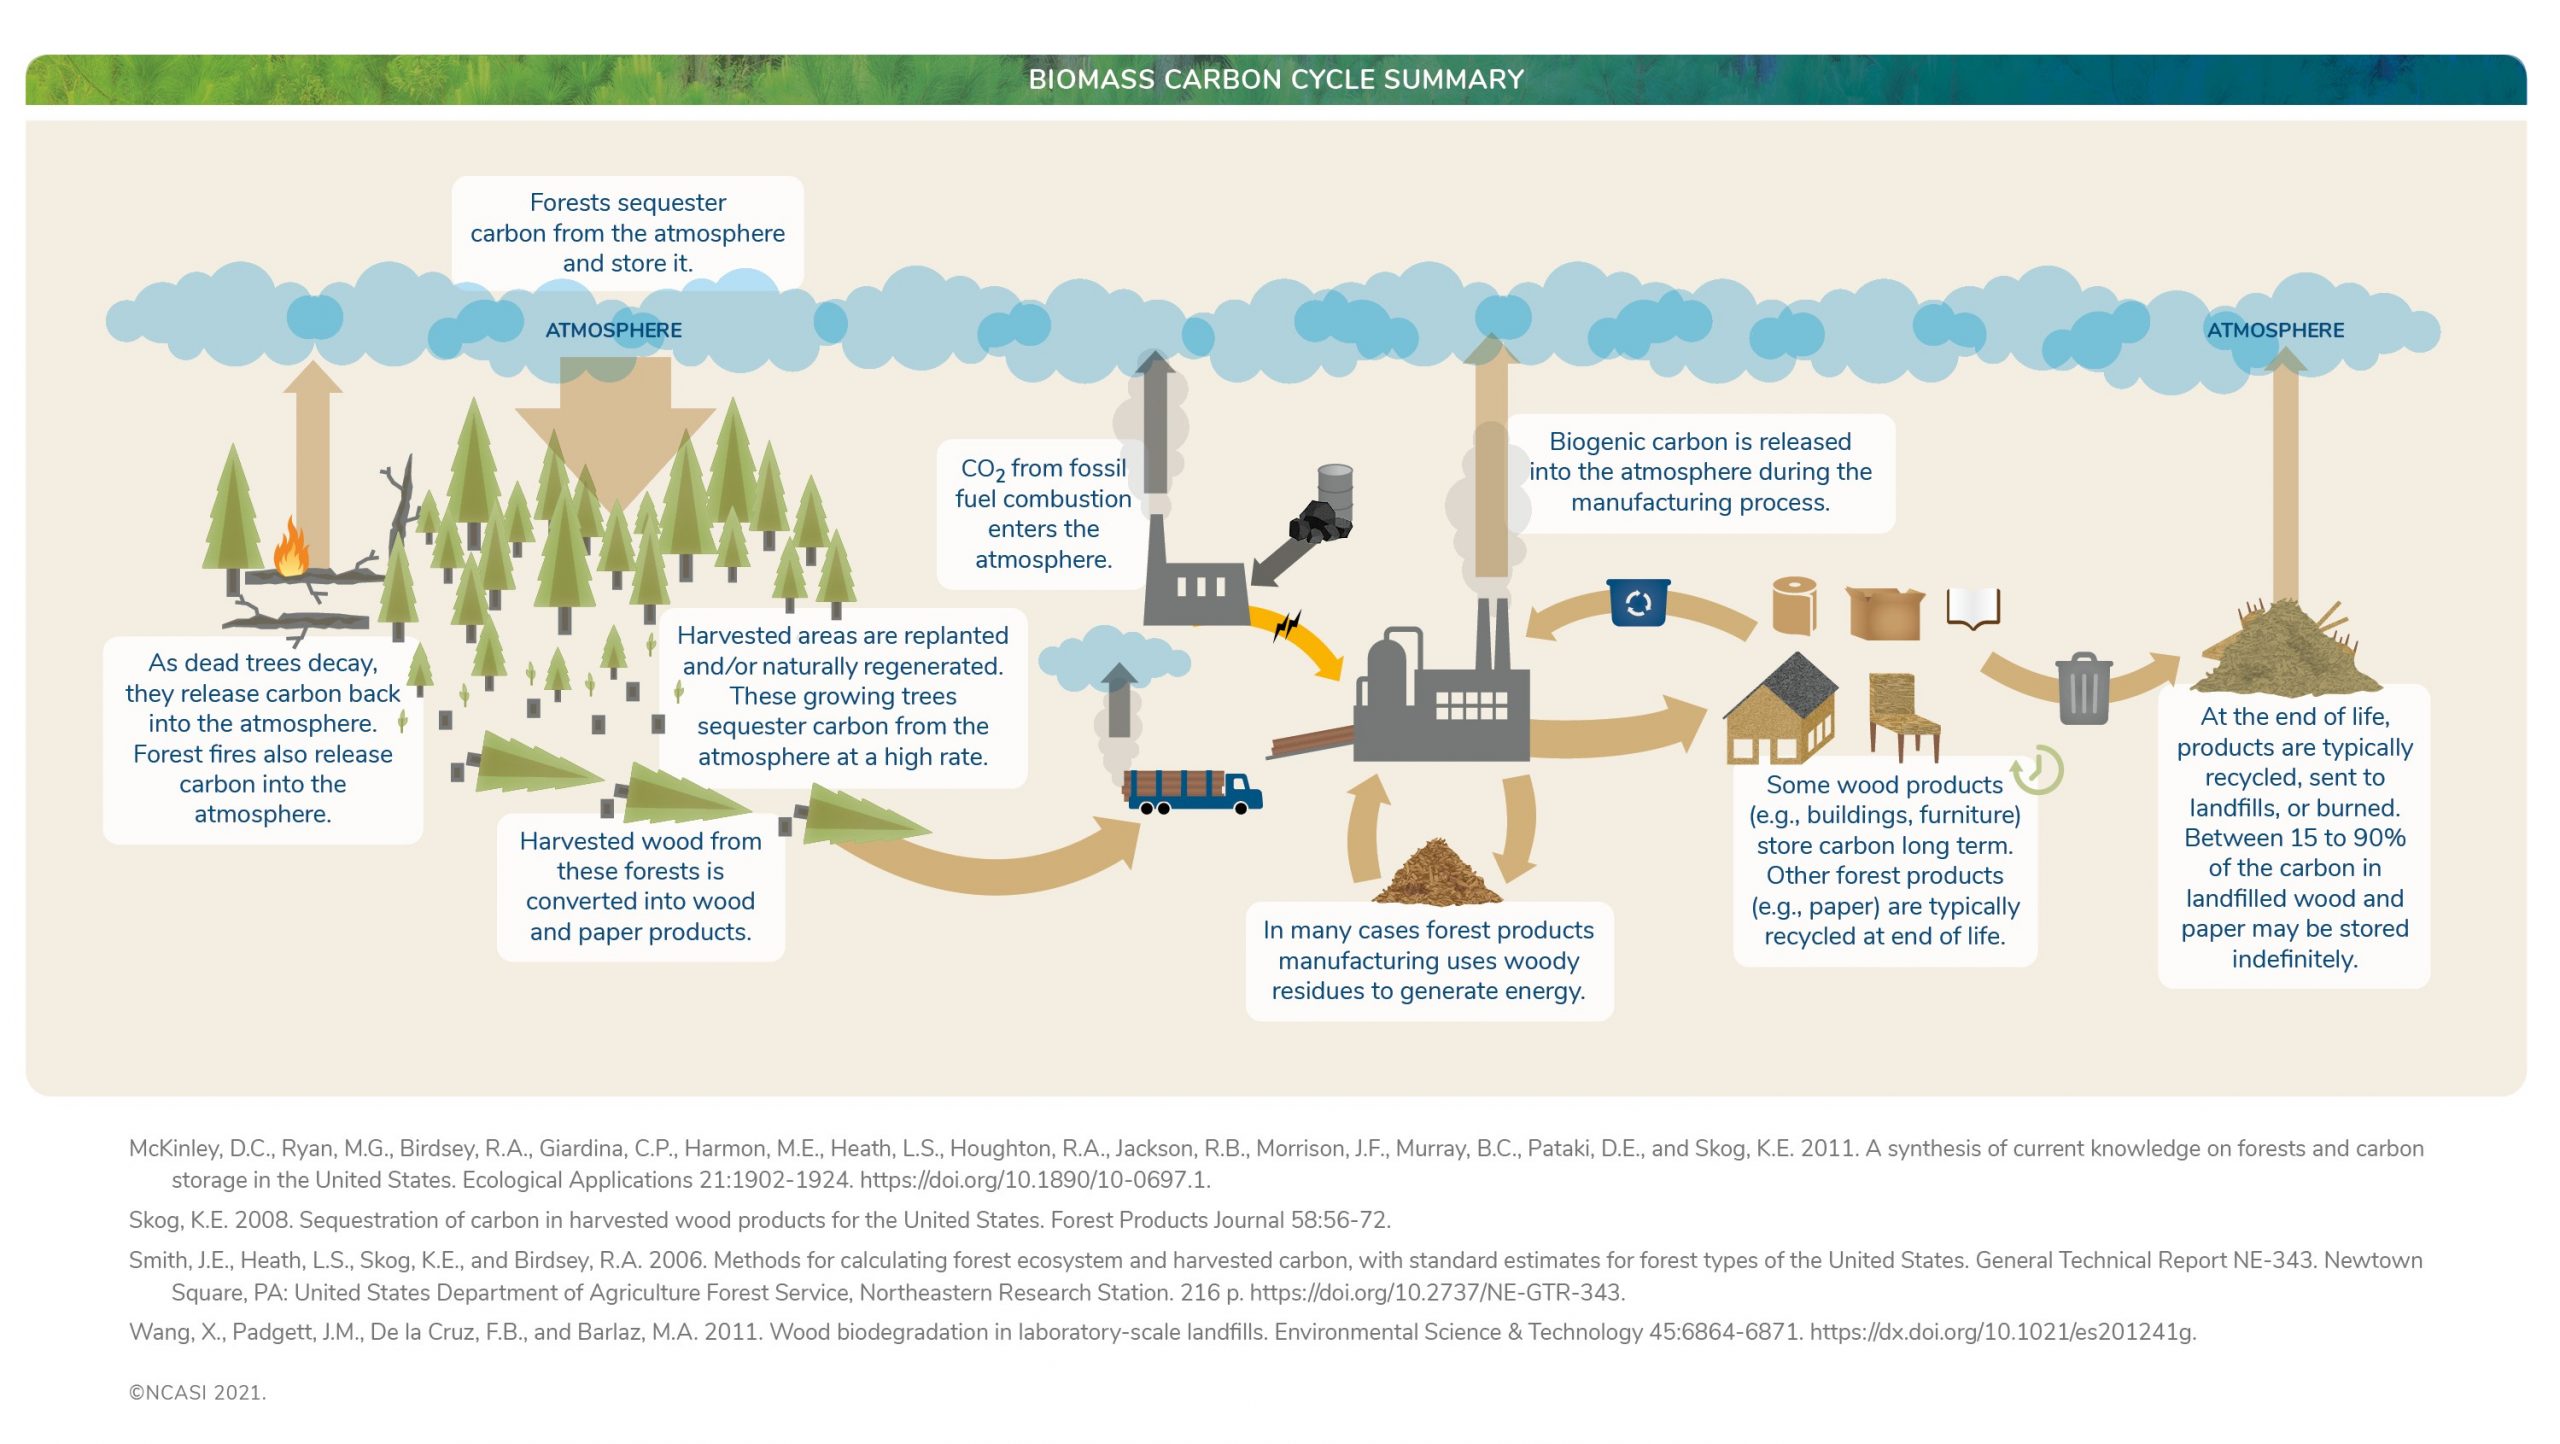
The forest sector is frequently asked questions regarding its use of biomass and needs to portray this use in the context of the overall biomass carbon cycle. This infographic illustrates the biomass carbon cycle from the forest through to harvested wood products, highlighting the renewability of the forest and the long term storage of many forest products. The data contained in the infographic are sourced from an array of peer-reviewed publications.
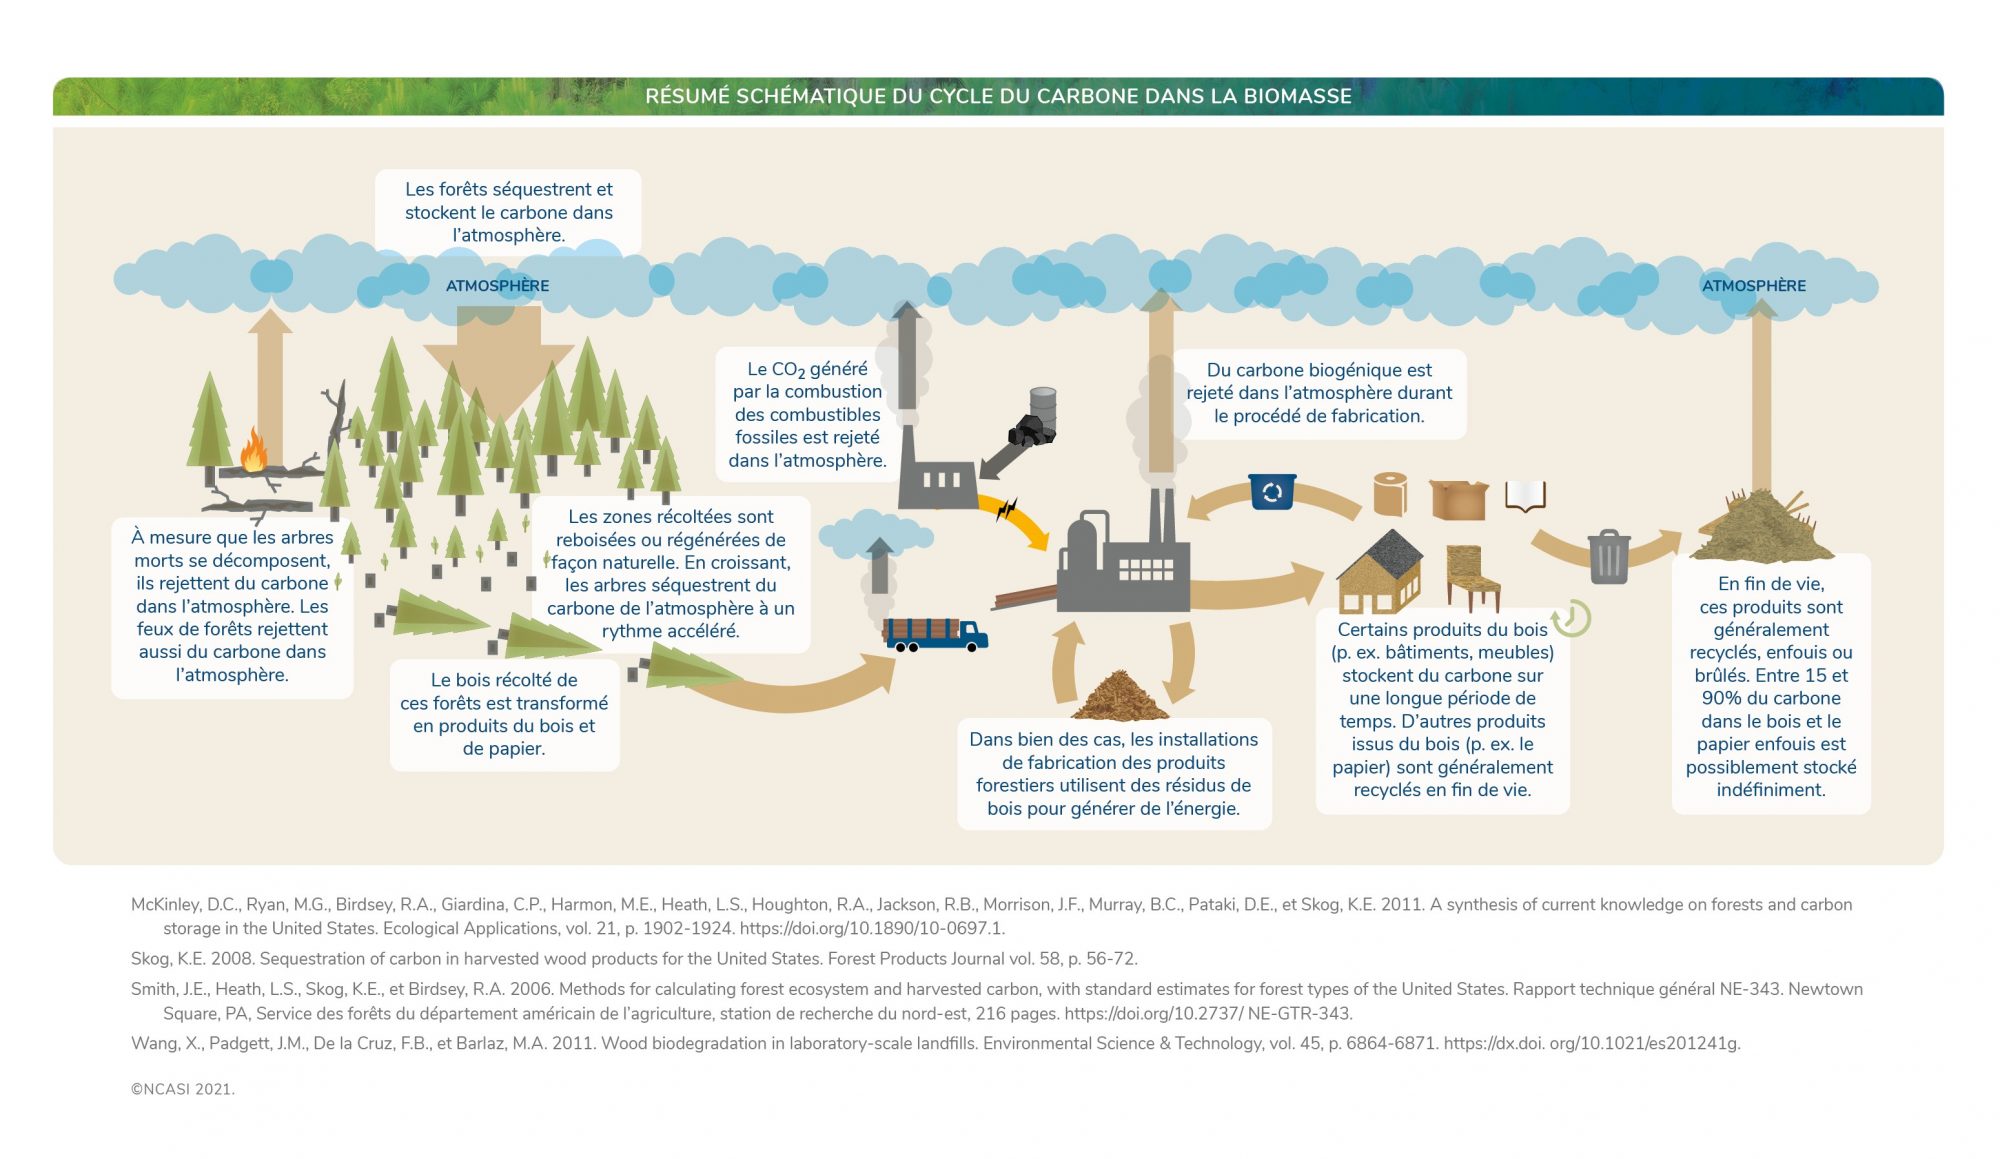
NCASI Biomass Carbon Cycle Infographic French